
No 02 · Field notes
Habit Streaks Vs Consistency: How To Read Your Progress
By Sebastian Röhl, creator of HabitKit
7 min read Published Updated
A streak measures your current run of successful days. Consistency describes a longer record, including the gaps. You can have a short streak after months of regular practice, so read both the streak and the history before deciding how you are doing.
In HabitKit, the grid keeps earlier days visible when a streak breaks. It records progress; it does not measure whether a behaviour has become automatic.
On this page

Reading Your Own Grid
Use the record to answer a specific question: how often are you showing up, and what gets in the way?
- Read the grid before you read the streak, particularly on the day after a gap. The grid is the evidence. The streak is the headline.
- Completion Rate, on the Charts screen with one build habit selected, is a year-level summary, and it is not a consistency measure either. It divides the amount you logged that year by the days since your first completion in it, multiplied by the habit's current daily goal, and stops at 100. So it counts logged amounts rather than successful days, and it scores the whole year against today's goal: raise the goal and the number can fall without a single past day changing. Charts are part of Pro, along with everything else Pro unlocks.
- If the streak number is costing you more than it gives, turn it off. Show Streak Count and Show Streak Goal sit under Dashboard Customization in Settings › Overview. They are Pro toggles too.
- Set the interval to match the habit rather than the calendar. A weekly goal of three means three distinct days meeting the daily target, whichever days suit you.
- When a break does happen, note what actually caused it. That is the difference between a fact about your week and a verdict on you, and the research says the distinction changes what you do next.
None of this is an argument against streaks. It is an argument for knowing which question you are asking. If you want to know whether today should be a day you show up, the streak is a fine thing to look at. If you want to know how you are actually doing, look at the grid, and if the two disagree, believe the grid. For the fuller version of what a single gap costs, see what one missed day does to a habit, and for the part that prevents most gaps in the first place, choosing a cue you will actually notice.
What The Streak Number Answers
For a build habit with a Daily streak goal, a streak counts consecutive days when you met the daily target. It describes the current run rather than the history before the last missed day. Which is why a habit you have kept for two hundred days and a habit you started on Friday can both read three. Weekly and monthly goals allow gaps between successful days, provided you meet the target for the interval.
That is not a flaw. It is the number doing exactly what it says: describing the current run. It is not describing how consistent you have been, and the two only agree if you have never missed.
The difference matters when you are deciding whether a habit is going well. A short streak sitting on a long grid is a good record with a recent gap in it. A short streak sitting on a short grid is a habit that has barely started. Those are different situations, and they deserve different reactions from you.
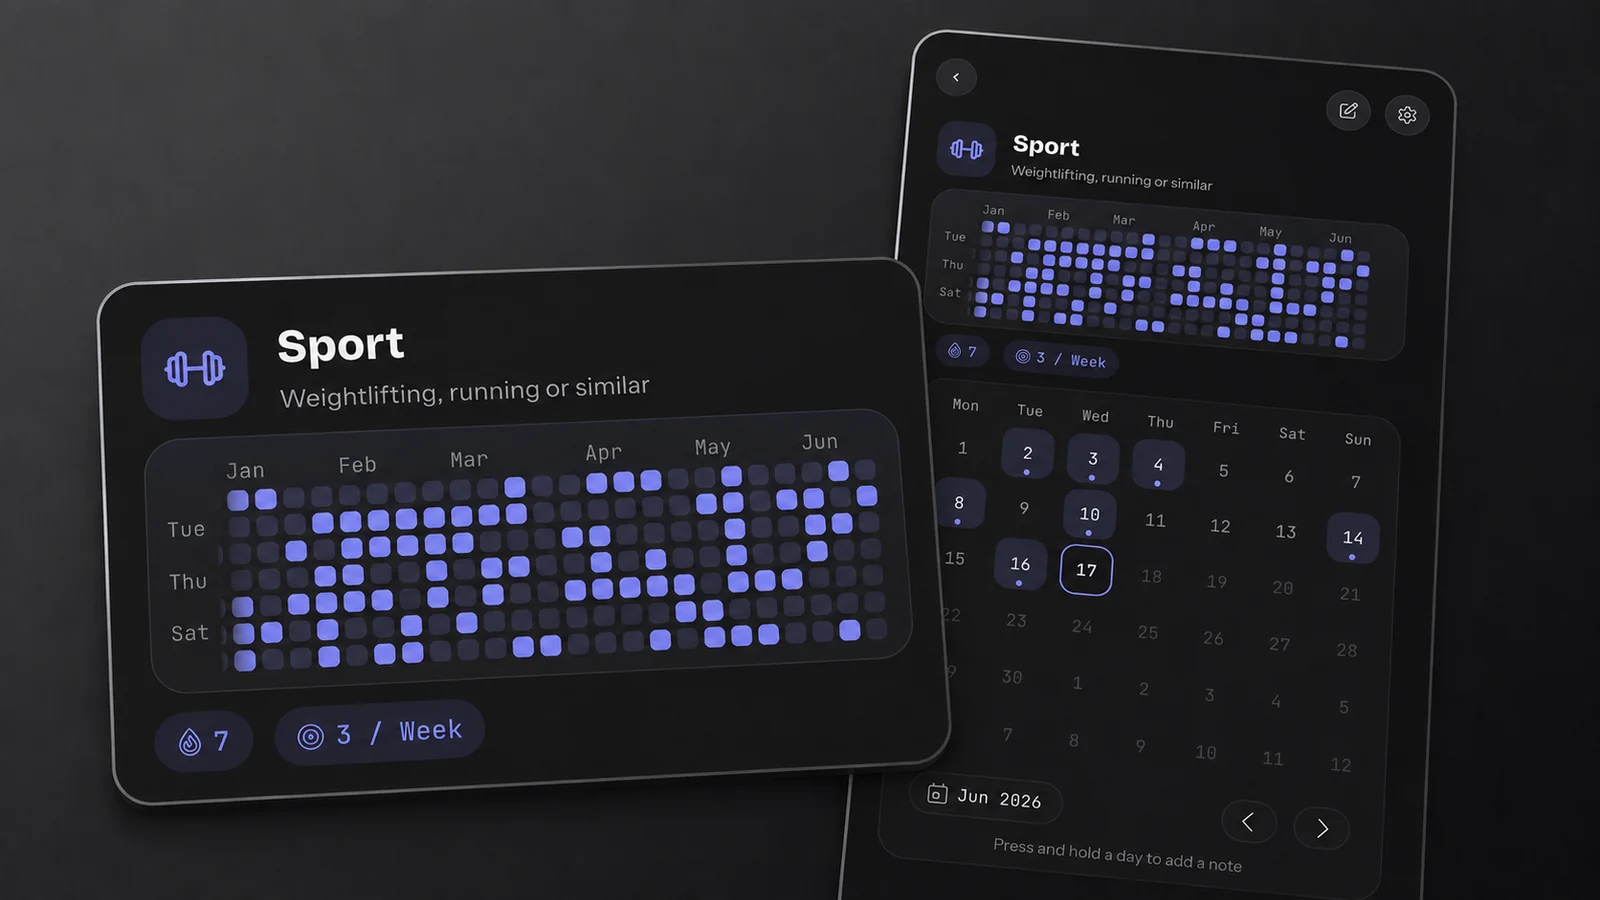
Example from HabitKit: the streak sits below the longer history. The empty tiles remain part of the record.
Why The Number Still Pulls
Streaks are not a trick, and the evidence behind them is better than most things in this field. Jackie Silverman and Alixandra Barasch ran seven studies on logged streaks, published in the Journal of Consumer Research in 2023. An intact streak shown in a log raised how much people did the behaviour afterwards, compared with a broken streak shown in a log.
The part worth looking at twice is what the effect did not depend on. It held regardless of how much the person had actually done. In the authors' words, the effect "depends solely on how that behavior is represented within the log."
So the streak counter is doing real work. It can motivate you while measuring the current run, and it is easy to mistake one for the other when both arrive as a number on the same screen.
The Effect Lives In The Display
If a number can move you independently of your actual history, then the number is a display decision. The same paper found two things about that display.
The first: the drop after a broken streak was larger when people put the break down to themselves rather than to their circumstances. The second: it shrank when the streak could be repaired.
Both are about how a gap is read, not about the gap. A tile you missed because you were ill and a tile you missed because you could not face it look identical. What happens on the next day depends more on the story you attach to the empty square than on the square.
HabitKit has no skip, rest-day or freeze feature that excuses a missed goal. You can correct a past entry if you did the habit and forgot to log it, but that is correcting the record. That distinction matters because the research found that repairability reduced the effect of a break. What the app offers instead is the grid, which keeps the whole record visible, and interval goals, which leave room for days off and are covered in taking a day off without breaking your streak.
One Claim Worth Not Making
You will read that your brain hates losing a streak about twice as much as it likes gaining one. That is loss aversion, from Kahneman and Tversky's 1979 prospect theory paper, and it is not settled enough to lean on. David Gal and Derek Rucker argued in 2018 that the evidence does not support losses being generally more impactful than gains. Kellen Mrkva and colleagues argued back in 2020 that loss aversion has moderators but is very much alive. It is an open argument between researchers, not a fact about your wiring.
The narrower claim in the section above needs none of it. In the logged-streak studies, displaying a broken streak reduced subsequent engagement relative to displaying an intact one. That is enough to design around, and it is the version that survives scrutiny.
Sources
- Silverman, J., & Barasch, A. (2023). On or off track: How (broken) streaks affect consumer decisions. Journal of Consumer Research, 49(6), 1095-1117. 10.1093/jcr/ucac029
- Kahneman, D., & Tversky, A. (1979). Prospect theory: An analysis of decision under risk. Econometrica, 47(2), 263-291. 10.2307/1914185
- Gal, D., & Rucker, D. D. (2018). The loss of loss aversion: Will it loom larger than its gain? Journal of Consumer Psychology, 28(3), 497-516. 10.1002/jcpy.1047
- Mrkva, K., Johnson, E. J., Gächter, S., & Herrmann, A. (2020). Moderating loss aversion: Loss aversion has moderators, but reports of its death are greatly exaggerated. Journal of Consumer Psychology, 30(3), 407-428. 10.1002/jcpy.1156
depends solely on how that behavior is represented within the log